-
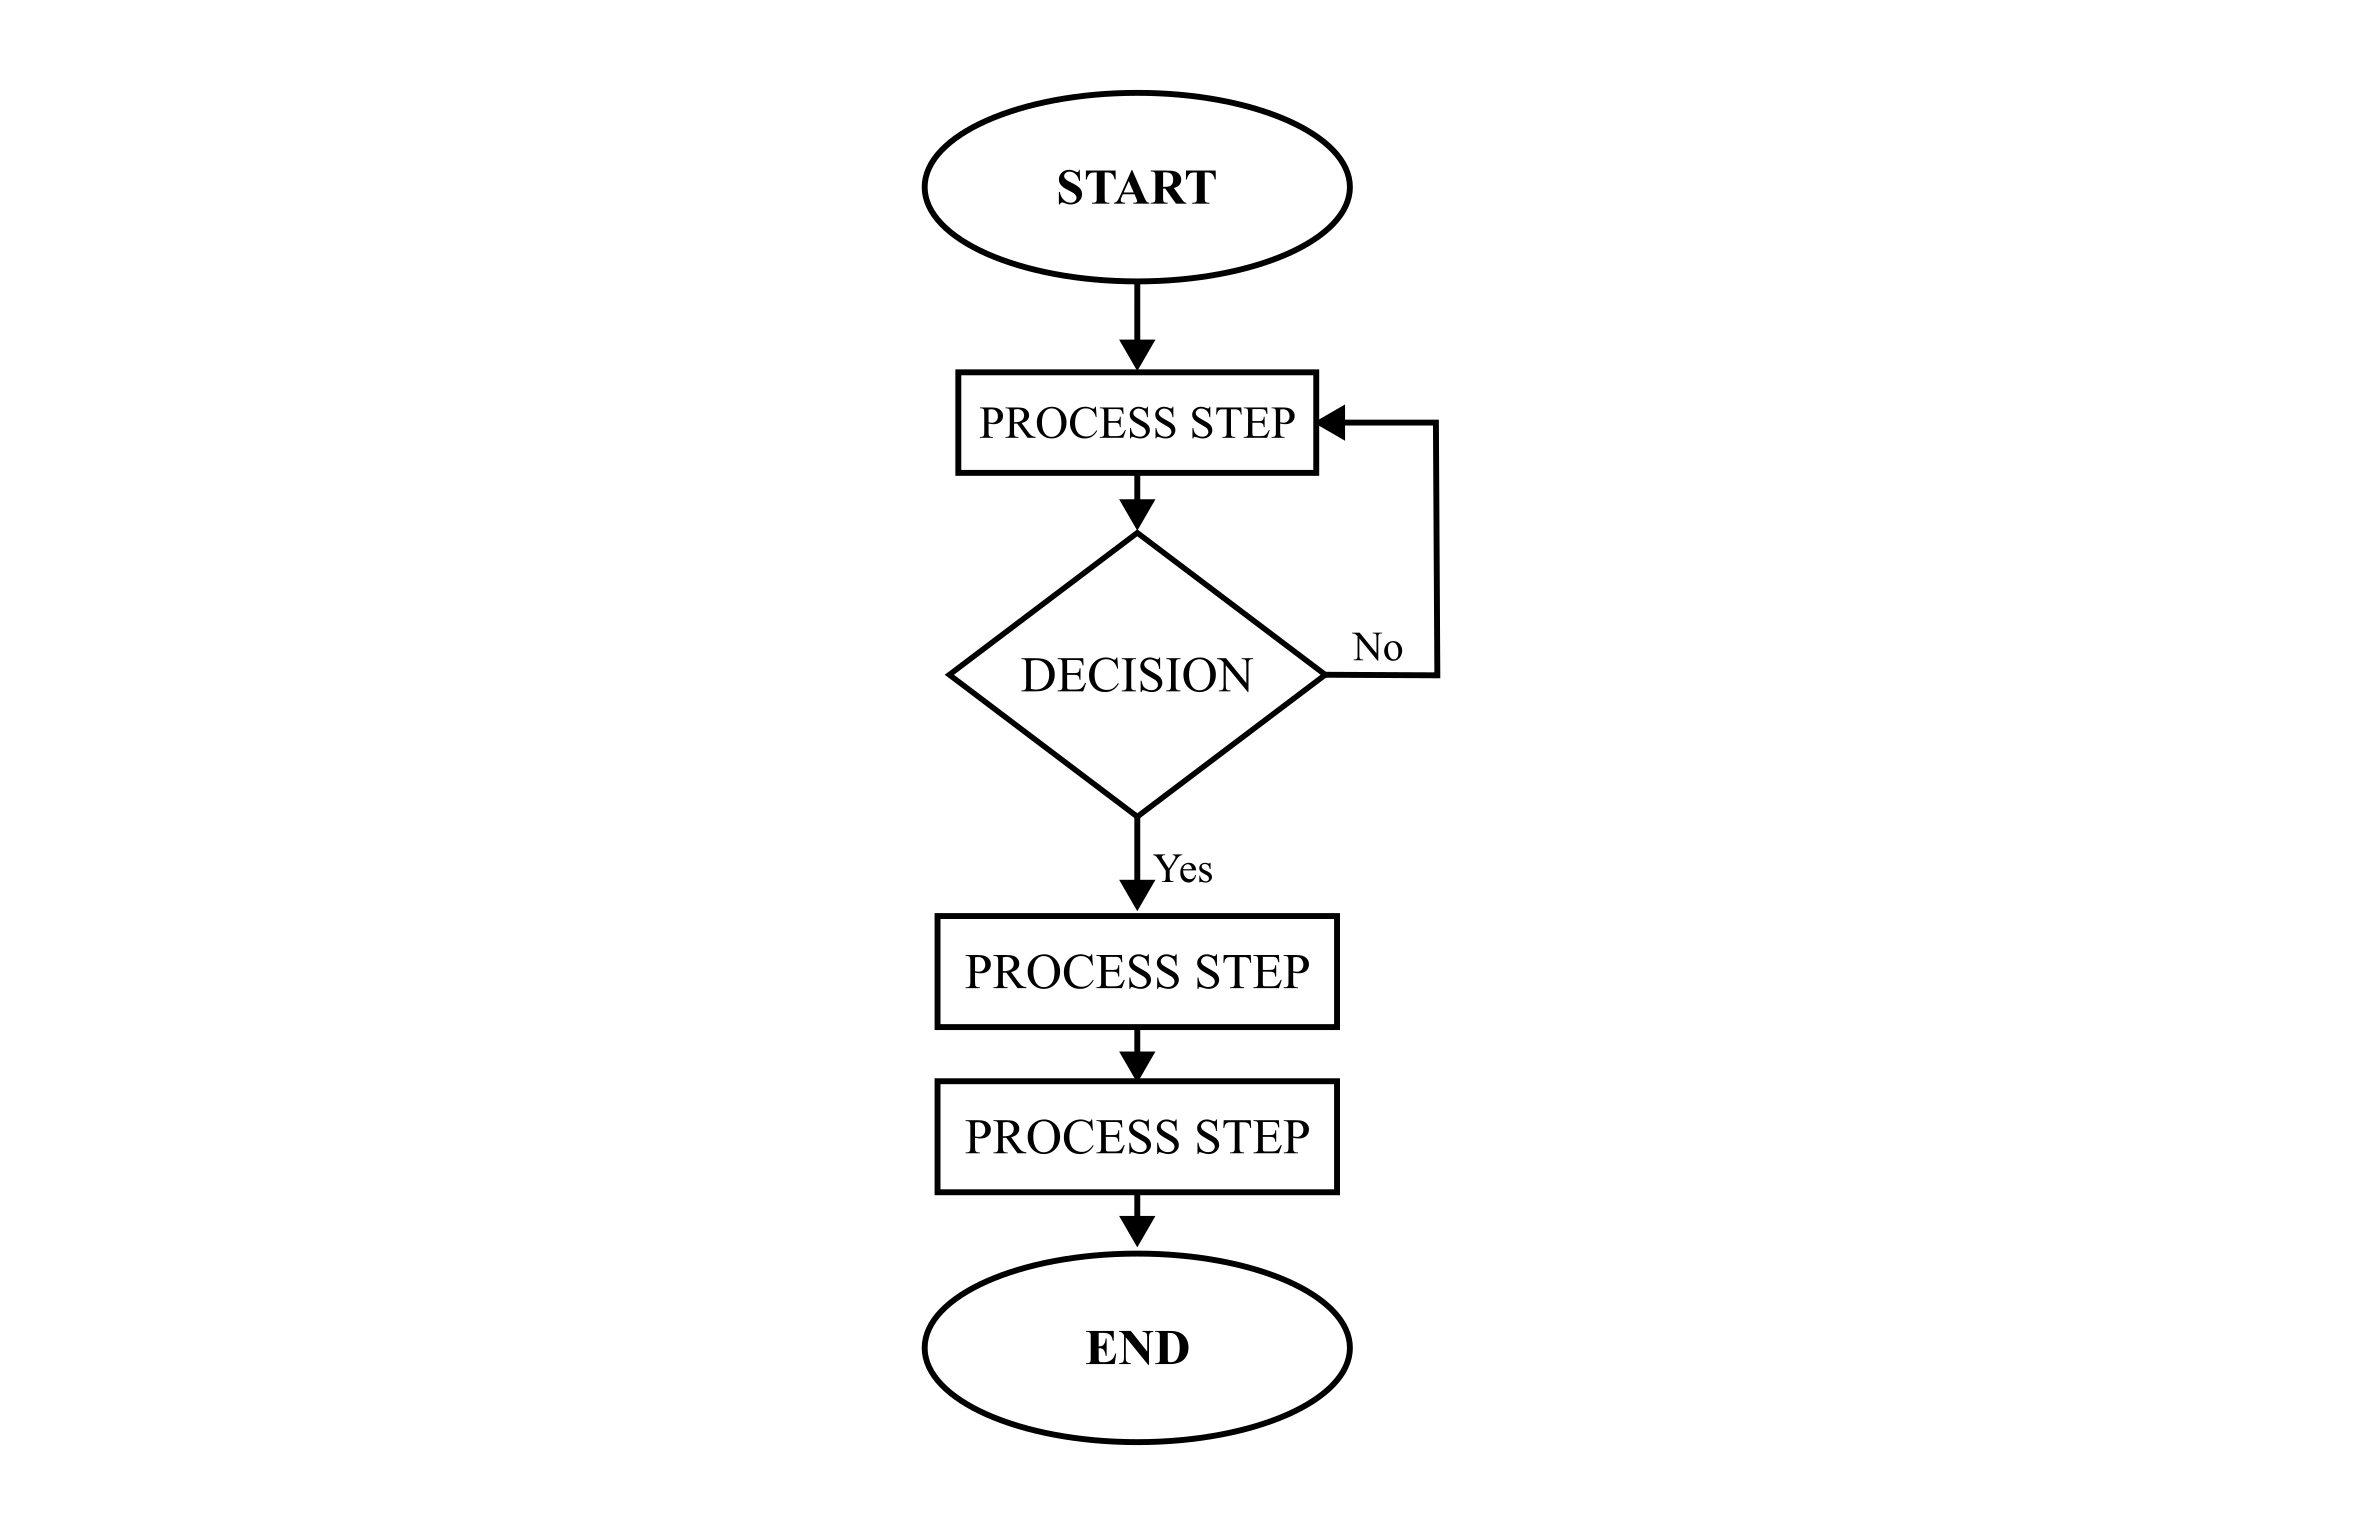
Visualize Your Process And Make Better Decisions With The Help Of The Flowchart
Like most quality tools, the Flowchart transcends the quality management barriers and is one of those tools that can be used in multiple fields. We can see frequent applications in software development, project management, education, sales, business process mapping, and so on. And chances are, you’ve most likely seen one of these around at some…
-

Easy Data Collection And Analysis With The Check Sheet
You may be glad to hear that you know this quality tool – and might’ve even used it before without realizing it. The cheek sheet is yet another one of those quality tools that is easy, and intuitive to use but can make a huge difference. The main idea of this tool is to have…
-
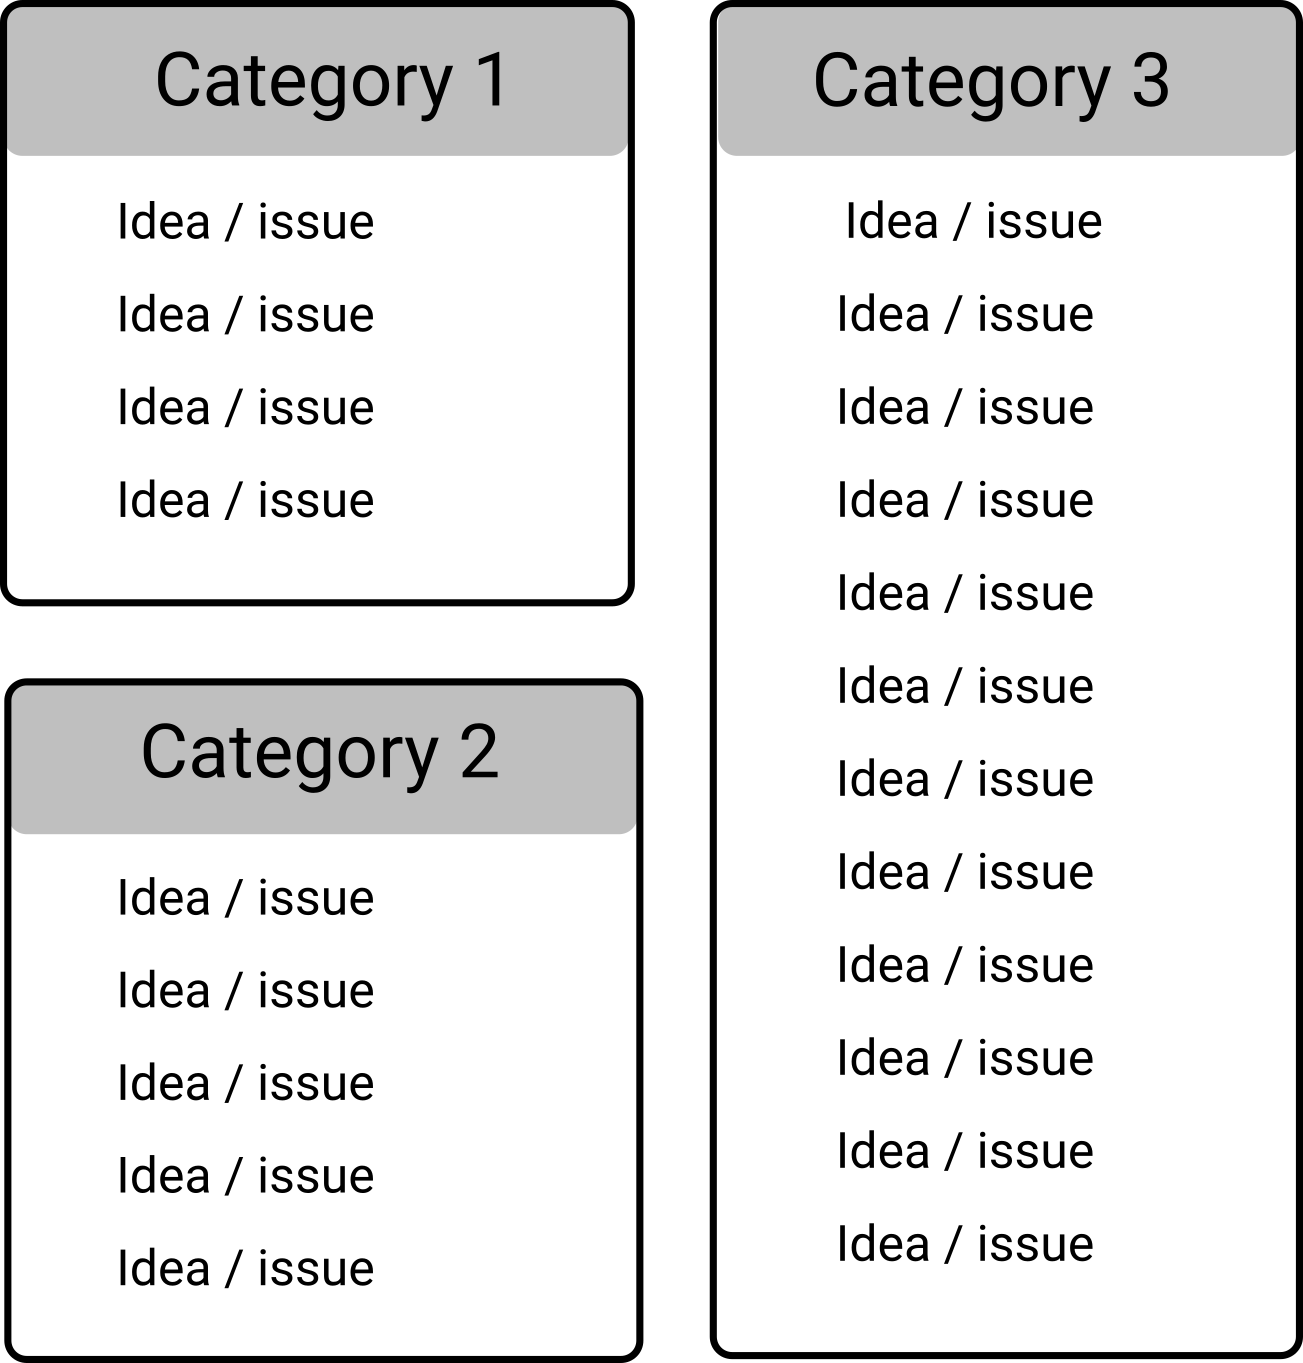
Organize Ideas Better With The Affinity Diagram
The Affinity diagram (also known as affinity mapping or the K-J Method) was created in 1960 by Japanese anthropologist Jiro Kawakita and although it may seem simplistic, don’t let that convince you that it’s also not incredibly useful. The diagram is useful whenever one is confronted with a large amount of data and/or ideas (like…
-
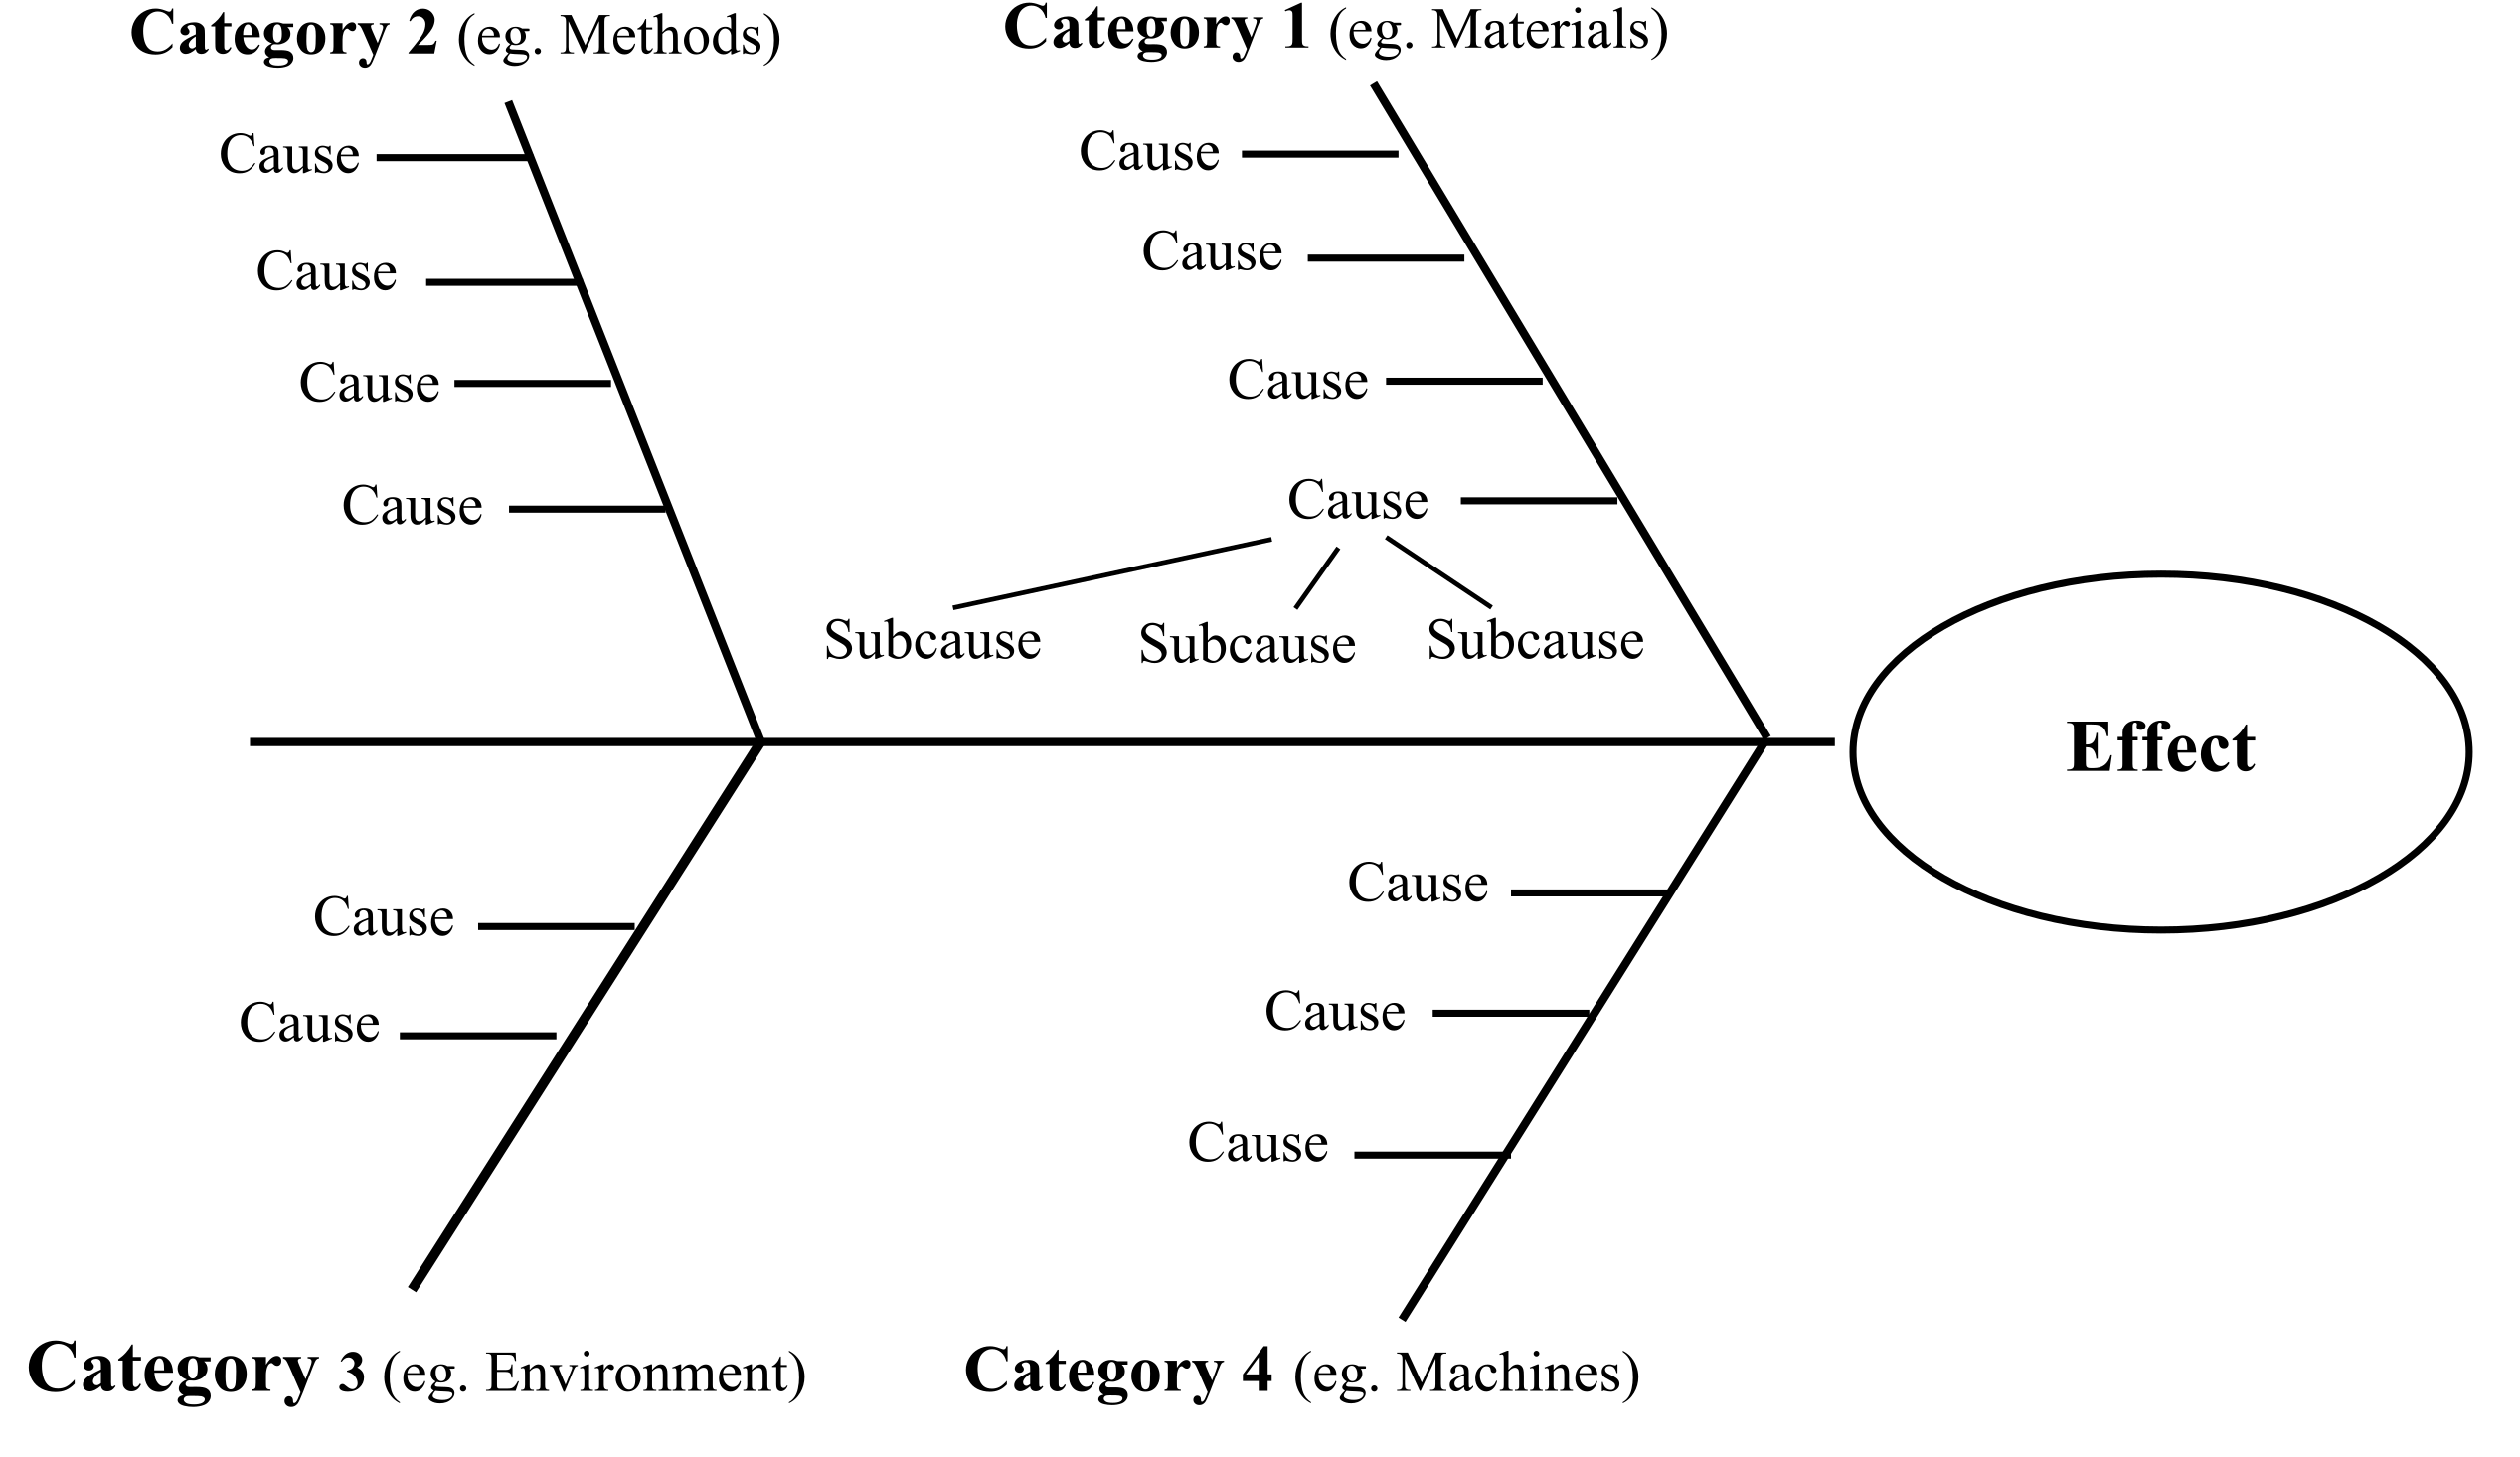
Quickly Identify And Visualize Causes With The Fishbone Diagram
The Fishbone diagram, also known as the Cause and Effect or Ishikawa diagram is a quality management tool that allows you to quickly identify, visualize, and organize “causes” or “problems” that can lead to an effect. The diagram was developed by Kaoru Ishikawa and first presented in 1945 as a tool for analyzing the causes…